Can you perhaps share this file, or can you provide detailed steps on how I can replicate this issue on my end? Thank you.
Sure, here it is.
Thanks for the replys, i dont now if it makes any difference but the model in this case is exported form sketchup. But i tried connecting it to d5 on a new proyect and it works
sorry here it is
I’m having similar issues. When I try to use scatter, it tried to load but never gets past that stage, then completely freezes my entire system and I need to reboot. Any suggestions?
I apologize for the inconvenience. Does this issue happen in all of your files? Even empty and new D5 files?
Can you send us the following:
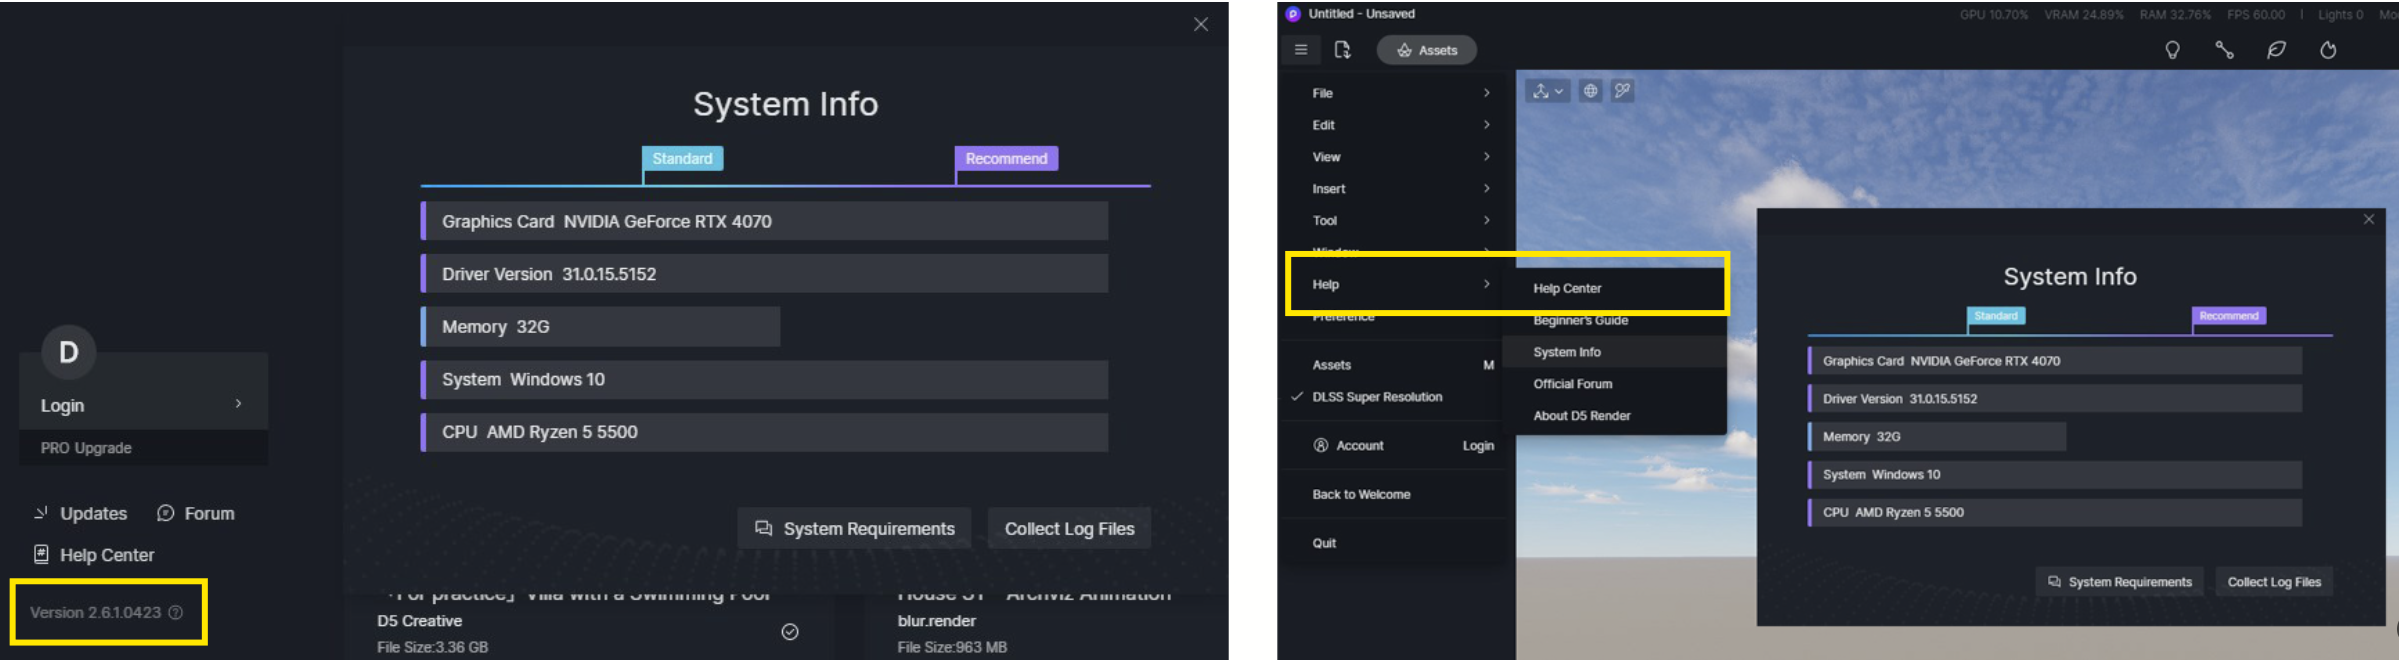
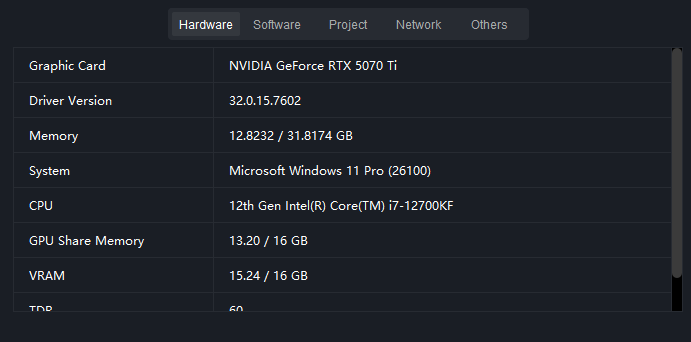
- System Information
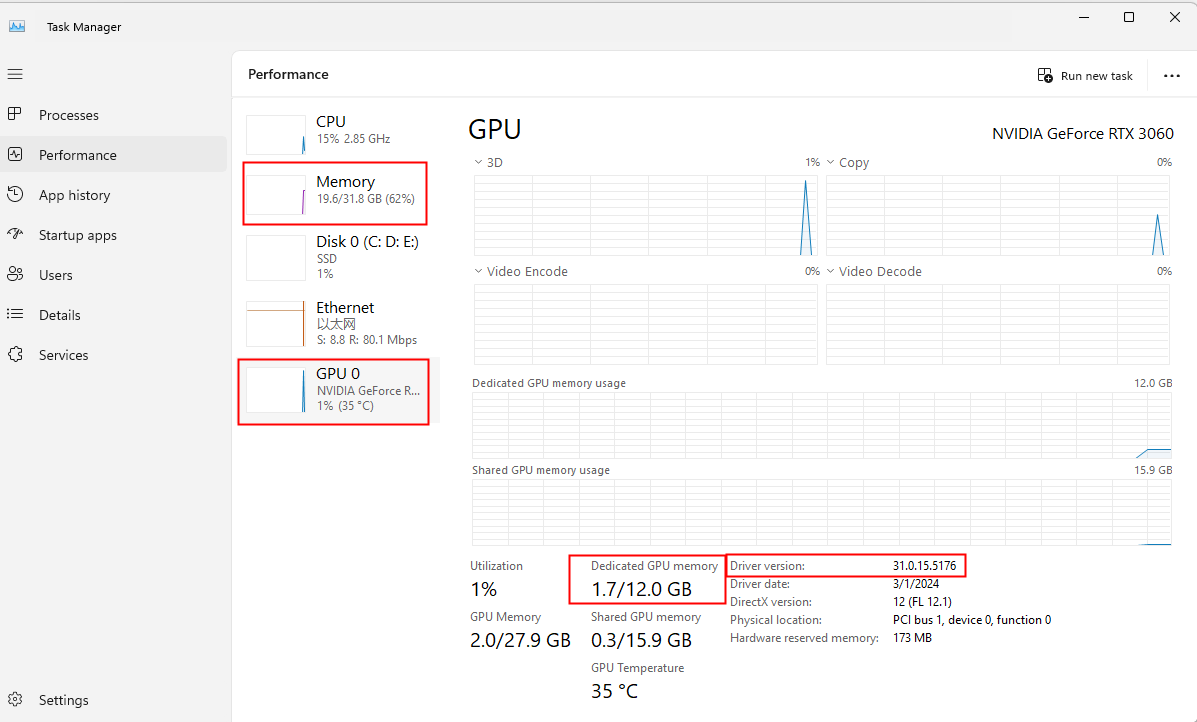
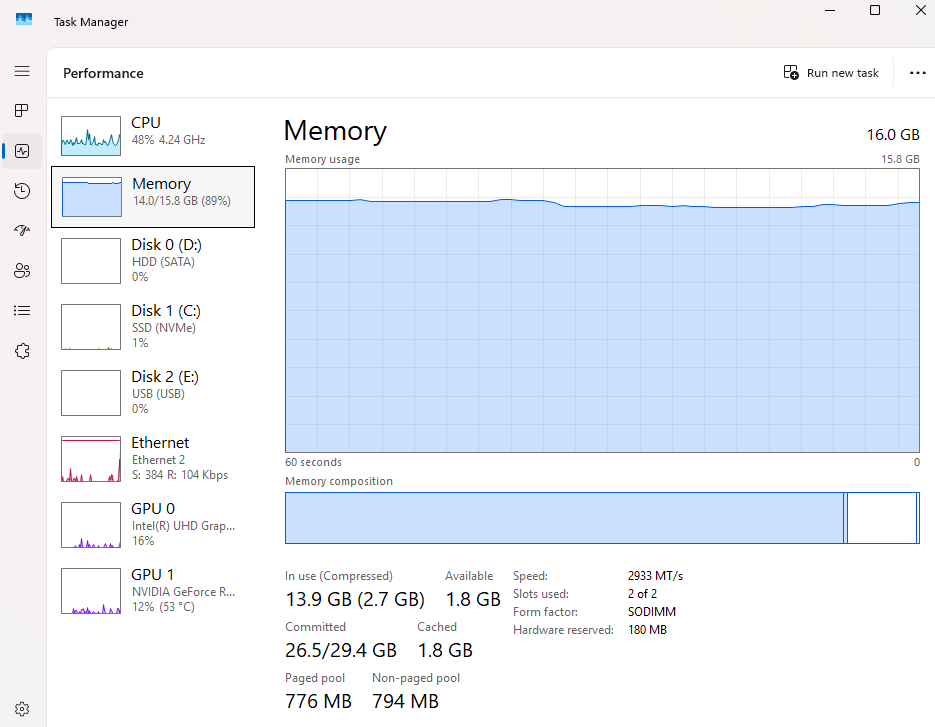
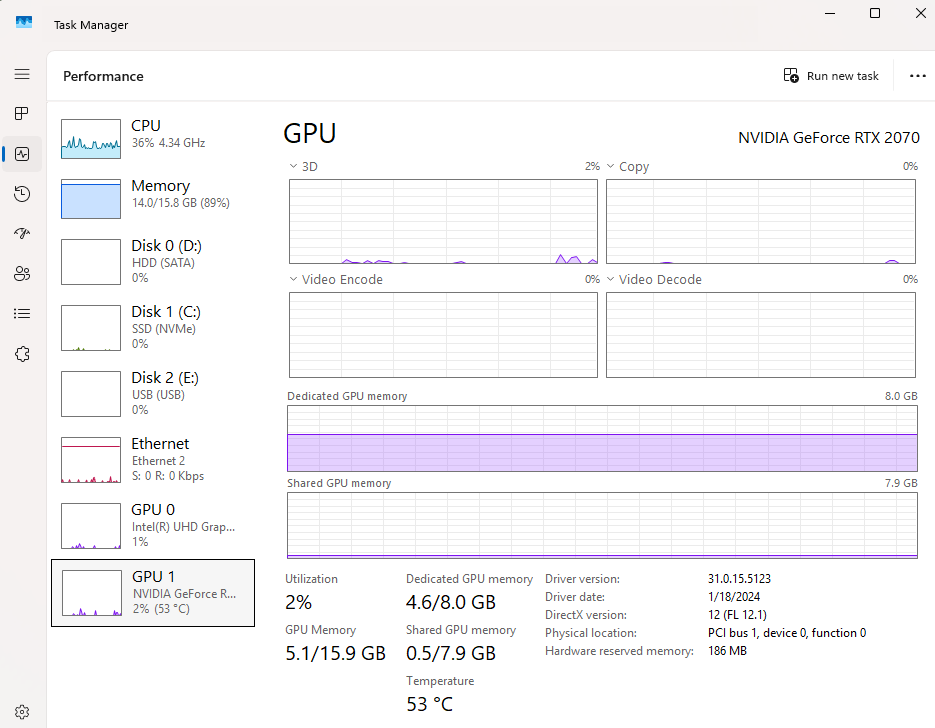
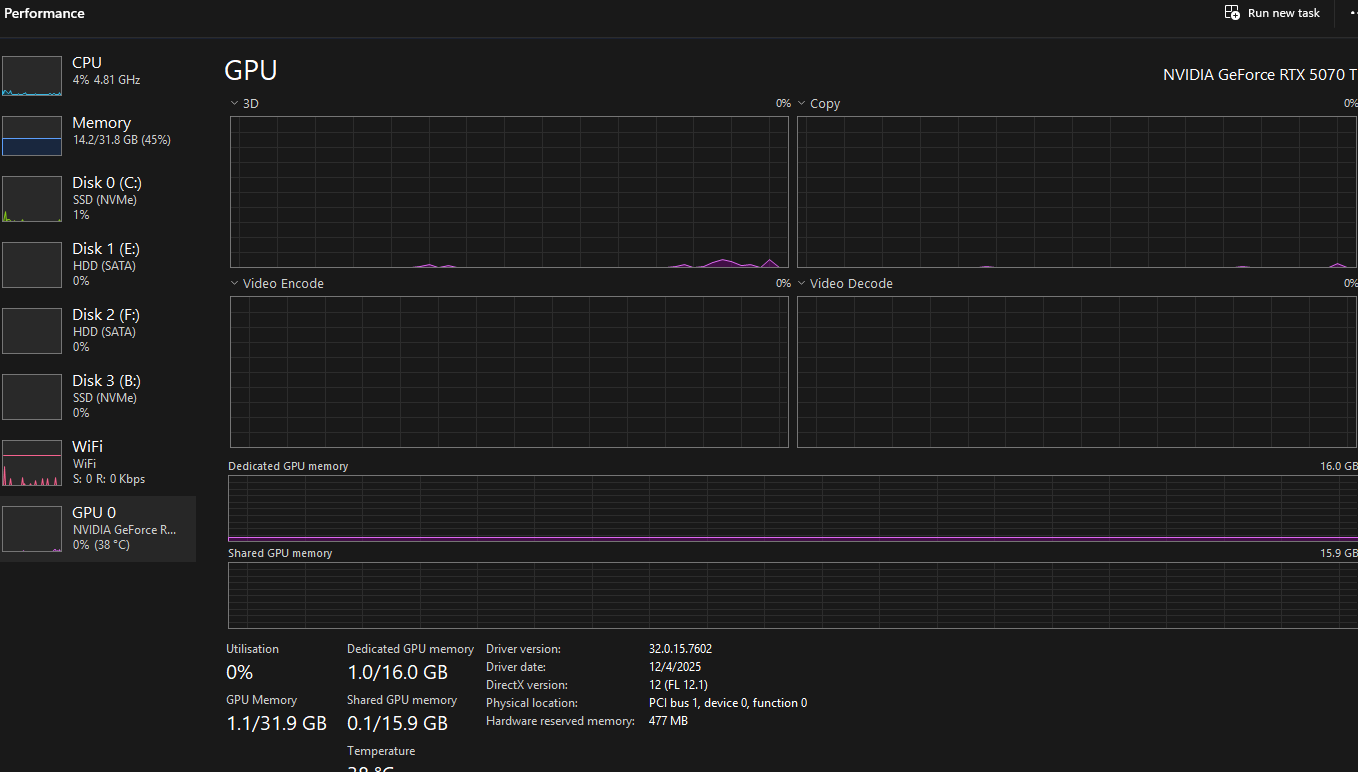
- VRAM
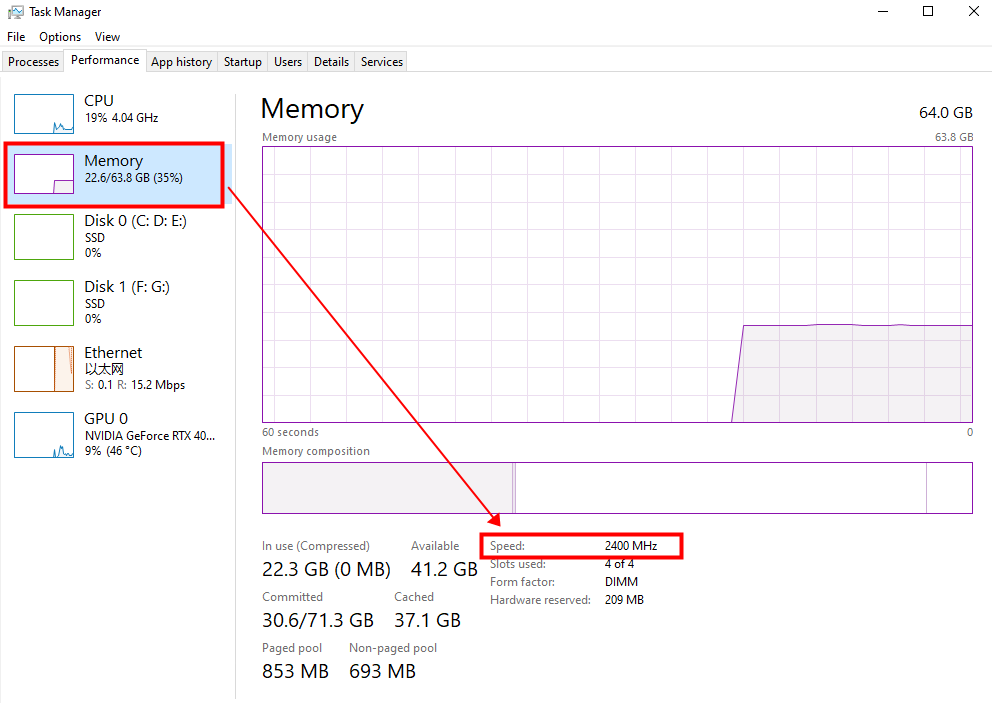
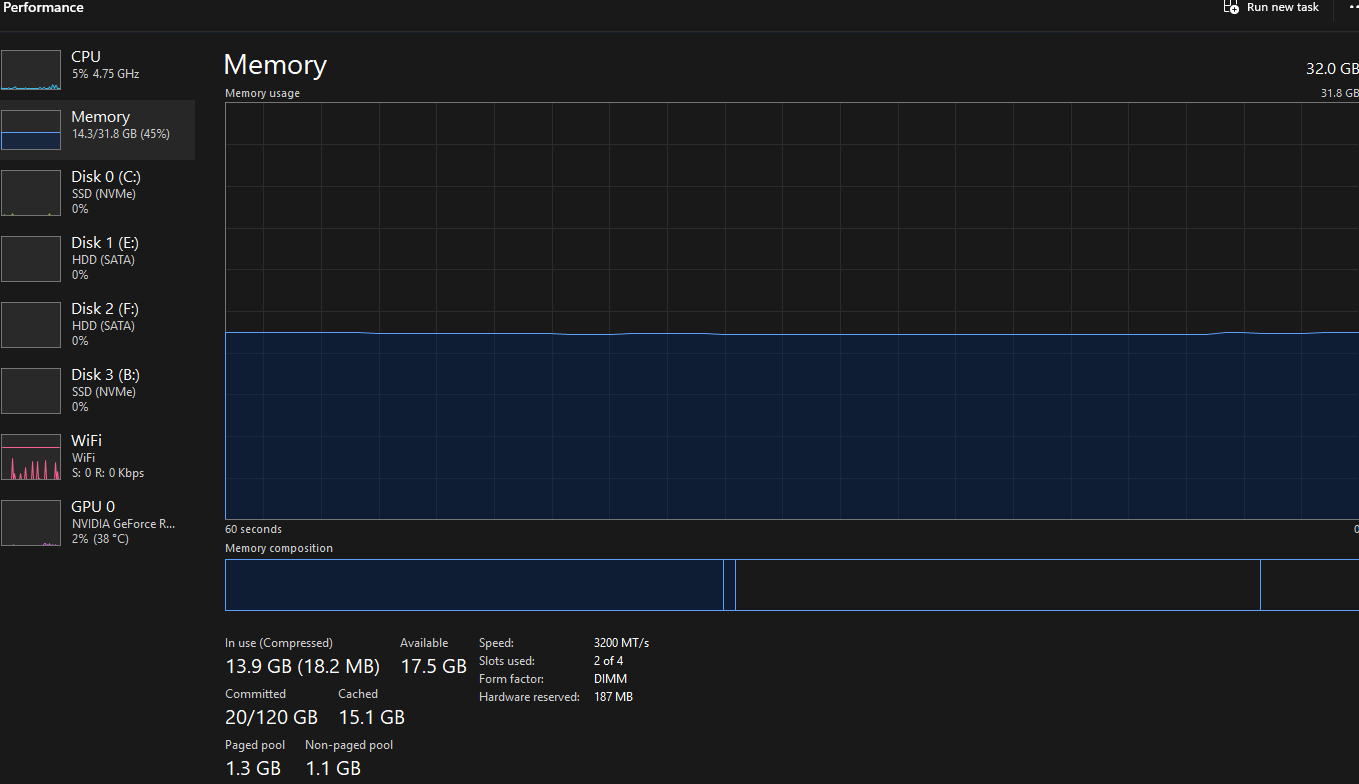
- Memory Speed
Under normal circumstances, even if the files are heavy and GPU Usage has exceeded, it will only cause D5 Render to crash, and by all means, will not completely freeze your system. Please check:
- Update your Graphics Card Driver
- Update your Windows System
Hi Clov, thanks for your reply. I havne’t tried it with other D5 files yet. I will do that.
Here is my system info below.
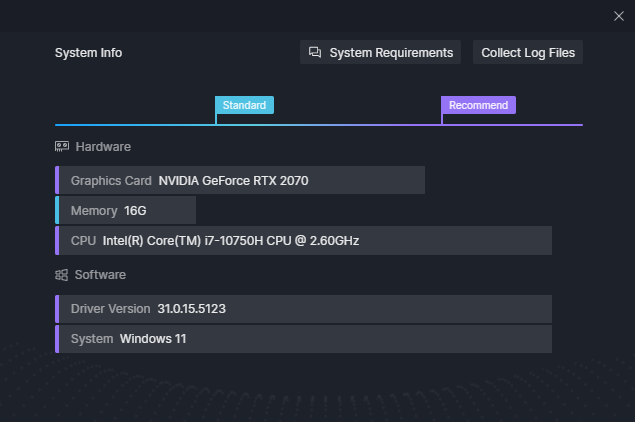
I also checked and saw I had the latest graphics driver.
What do you think?
Thanks for sending the requested information/images. Please open the D5 Render File, which has some issues when accessing the GPU Information.
-
The latest NVIDIA Drivers as of April 16, 2025, are 7602, which is quite far from your version 5123. You may update via your NVIDIA Application or directly from their website. It’s also best to check which version of the GPU Drivers are suggested for 2070 (Just to be sure)
-
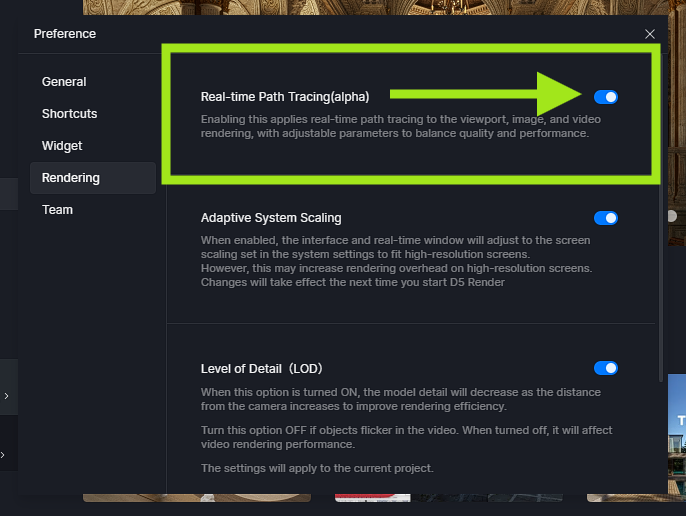
If this issue only occurred in the recent 2.10 update, then please try to disable Path Tracing and see if you can generate a scatter.
Thank you for your help. I updated the graphics driver and tried it. It’s working better overall, but the scatter tool is still locking the entire system up. Can you tell me where the Path Tracing disable is located?
Thanks for the confirmation.
-
Can you confirm if this particular issue only persists in this specific file? Can you try other files? Perhaps an empty or a Demo Scene File?
-
This issue is only evident when you generate a scatter, right? And using other tools in D5 Render is normal?
-
Path Tracing can be disabled in Preferences
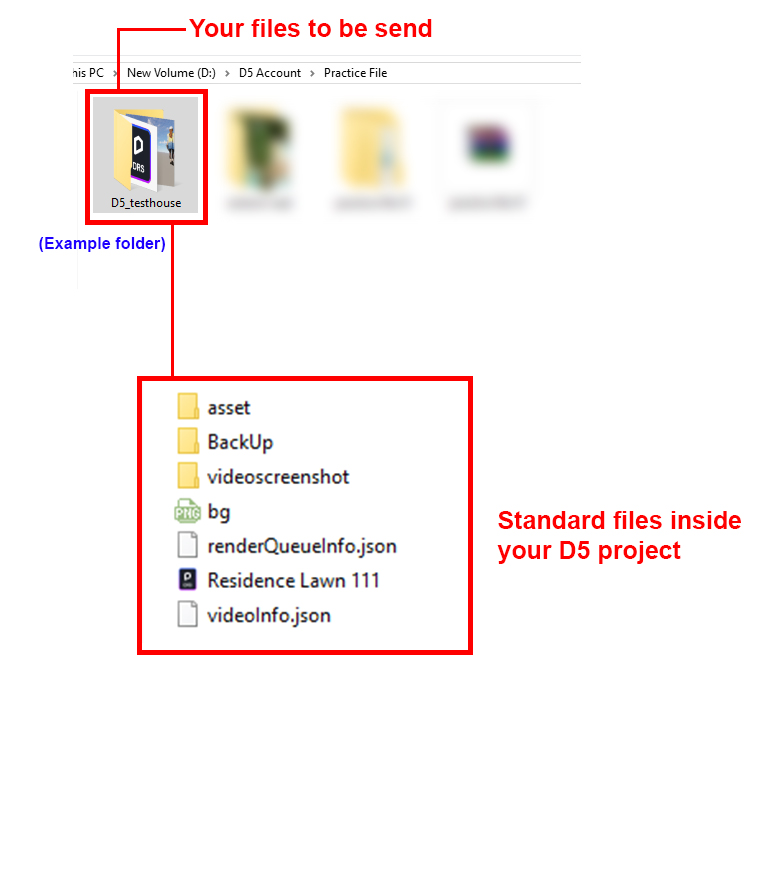
We may need to collect your D5 Scene File or Log File so we can further investigate this issue.
-
You may send your file to support@d5techs.com and have it titled ‘Clov-Forum Unable to Use Scatter’
-
Log File - How to use Support Tool? | User Manual
I tried it with an empty file and it does the same thing. When I went to disable Real-Time Path Tracing it was already disabled.
I’ll email you the log files for this project.
Hopefully we can identify the issues. Scatter is the only tool that causes this system freeze, everything else in D5 works smooth.
We have tested your file and it seems that this issue is related to your device’s RAM. After we have opened your file, D5 Render takes about 5GB to 6GB RAM + plus the system itself also does the same + an additional when Scatter is being used. Hence, 16GB may be insufficient most especially when working with larger files or performing/using a tool which is quite heavy.
If it’s possible to, please upgrade your RAM to 32 GB or higher.
- You may also use 2.9 Version and see if this issue persists. Download Historical Versions of D5 Render - Get Help - D5 RENDER FORUM
Please let us know if reverting to 2.9 Version will improve the situation. Thank you.
Hello Clov,
I have since upgraded my RAM from 16 GB to 64 GB, and have tried scatter both with a working file and a blank file. The computer no longer shuts down, but D5 continues in a steady state of “loading”… after applying scatter to the terrain.
Any thoughts on what I should try next?
I’m experiencing two issues:
- Every now and then, my program freezes. It seems like the interface itself is still responsive, since I can click on buttons and menus, but they don’t make any changes in the preview window. I also can’t update scenes, and when I try to save, it gets stuck on “Saving project…”. After that, the only solution is to end the process from the Task Manager and reopen the project from the last successful save.
- Occasionally, when I click on a scatter and it starts loading (the loading bar appears on the right-hand panel), the program closes automatically.
I’ve already sent the email as suggested. I’m from Latin America and I’m using version 2010.1.0579.
I’ll be reaching out to you privately so we can shorten the troubleshooting process and solution in this forum topic and prevent some confusion.
I’ll be updating this topic once we have figured out the problem. Please check your DMs
I apologize for the inconvenience. Important question:
- Does this issue happen only to a particular file?
- Or is it evident in all the other files?
Can you please send me the following screenshots
- VRAM - Please open the D5 file and check your VRAM section in the Task Manager then send it to us.
- Memory Speed
Suggestions:
- Please try to revert back to a previous version of your Driver, 576.02 is known to cause some issues. I suggests using 572.47.
This happens to me with many files, not just the large ones—it also happens with some that aren’t heavy.
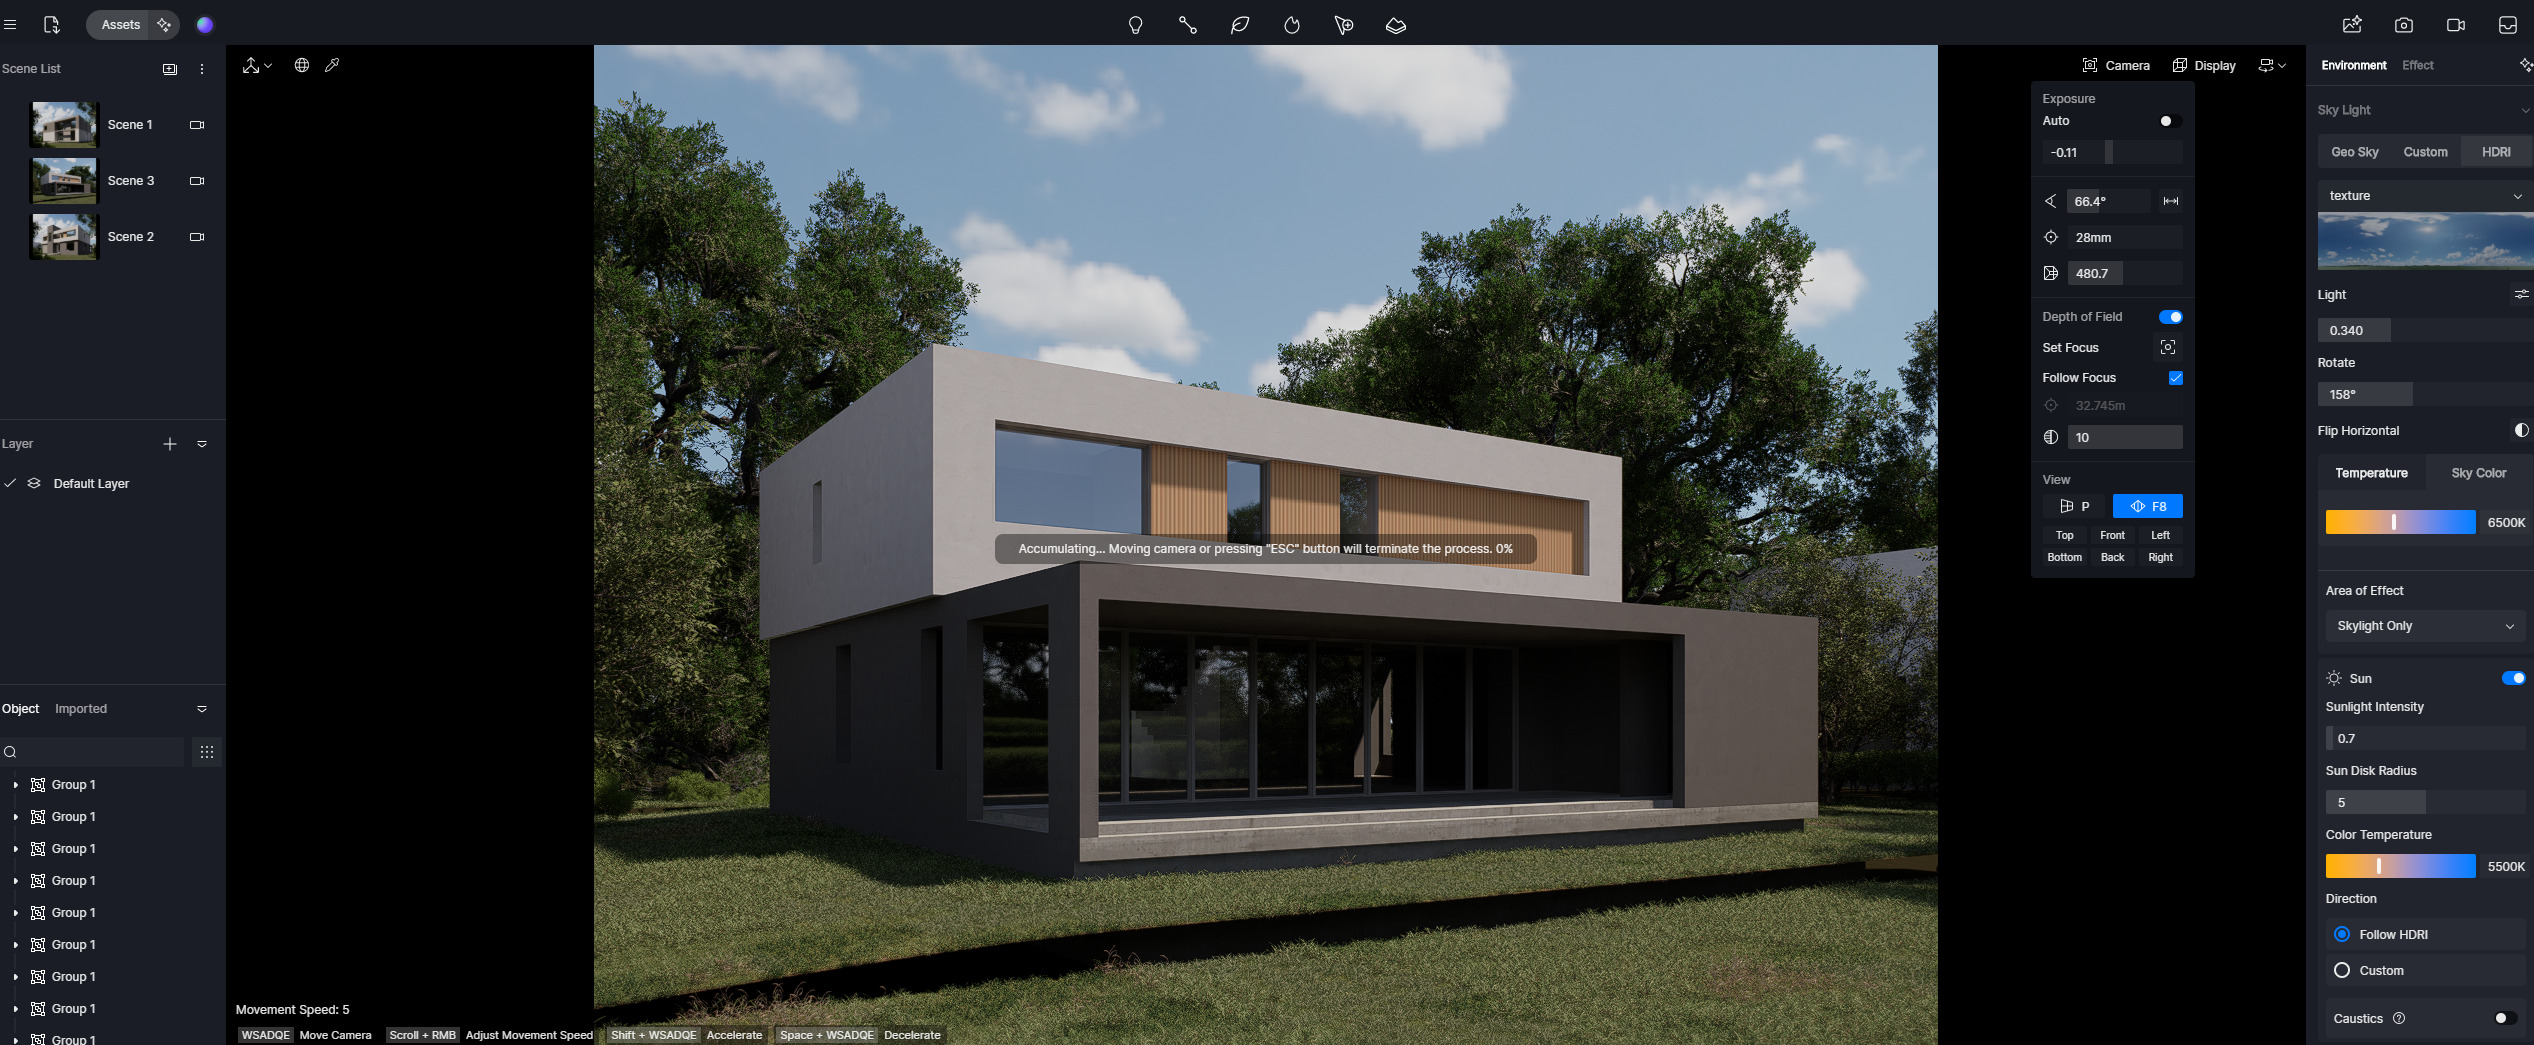
I’m also attaching this image to show that it’s really like the option isn’t checked. The only thing that doesn’t move are the saving or pre-rendering percentages, as shown in the attached image. Nothing changes in the preview either, but the interface itself still lets me click and open some menus.
Can you try to revert to a previous version of the driver? Perhaps 572.47? And see if there are any differences.