I am having a big issue with high VRAM usage on my project and I can’t seem to figure out what is causing it. My current setup is an Intel 12900K processor, 64 GB DDR5 RAM, and 4080 super (16GB) graphics card and the model is being livesynced from Rhino 7. I do have alot of heavily detailed interior blocks (imported) so my initial thought was to reduce the number of mesh faces in some of the heaviest blocks. Ironically enough, after optimizing several of these blocks and eliminating 59,000,000 faces from the project the VRAM usage actually increased by ~6% but the FPS also increased by ~4FPS which makes no logical sense. Here are the statistics prior to optimizing the blocks:
Just to clarify, I did save the project, close out of D5 and reopen it to before checking the statistics post optimization. Nothing I do seems to have any effect on VRAM usage and I have no idea if the imported model is the culprit or D5 assets? Even if I hide every asset in the scene the VRAM usage doesn’t change more than 1%. I’m completely stumped and and getting increasingly frustrated over the constant mystery of how D5 uses VRAM. Other people in my office are also experiencing similar issues. Any help with this would be greatly appreciated.
I apologize for the inconvenience this issue has caused. Can you please send me the following information?While running the current D5 File that you were pertaining
You may want to try the following steps to Optimize Graphics Memory Usage:
Start D5 Render with administrator privileges and restart your computer. The program will automatically modify the TDR values, which can improve the stability to a great extent.
Turn on DLSS.
Depth of field, Tyndall effect, and other settings can take up a lot of video memory, so use your discretion.
Higher resolution mapping will also take up video memory, you can replace the mapping of materials farther away from the camera with a lower resolution mapping and try to avoid using replacement.
More reflective scenes will reduce efficiency, you can turn the specular of materials far from the camera to 0 to cancel the reflection.
Windows’ own GPU usage data may not be accurate, we recommend using GPU-Z. Check the sensor-memory used parameter for better memory management.
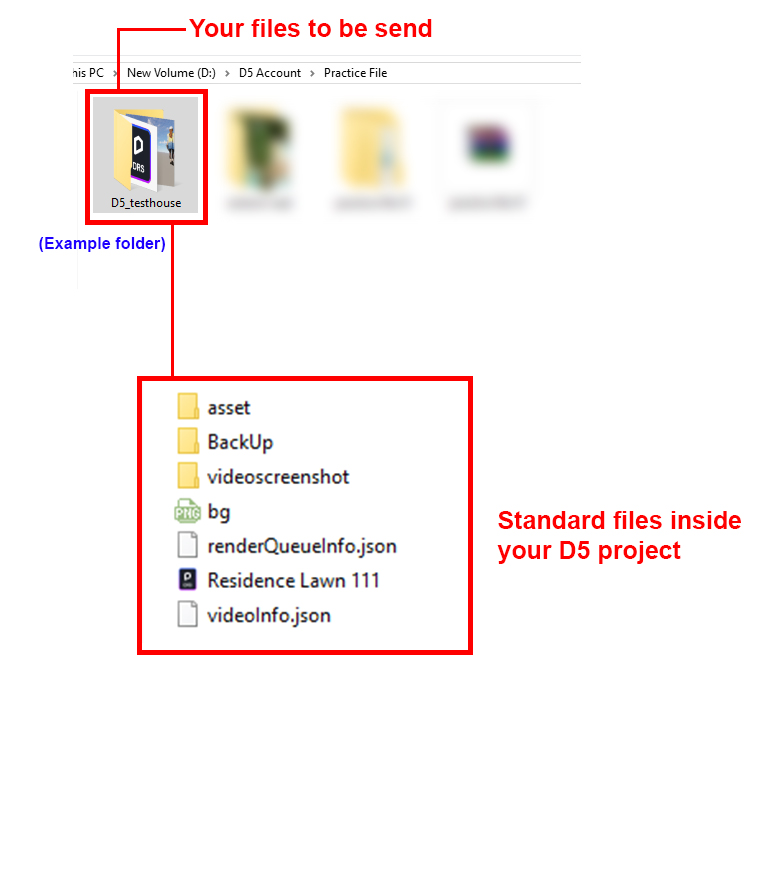
May we confirm the steps on how you were able to reduce the number of faces? Perhaps an overview of how you did it? Also, would it be possible for you to send us your file so we can also test in on our end (D5 and Rhino File) ? You may send it to support@d5techs.com and have it titled “Clov-Forum Increasingly high VRAM Usage”
I have E-Mailed you a download link to the original file and the optimized file with all of the associated Rhino & D5 files for each.
The block optimization was done using Rhino’s ‘reducemesh’ command. The only difference between the original file and the optimized file are (2) blocks that were reduced. They are located in the folder: Rhino → Blocks → Objects → Reduced. The two blocks that were reduced are ‘Bouquet’ & ‘Table Setting’.
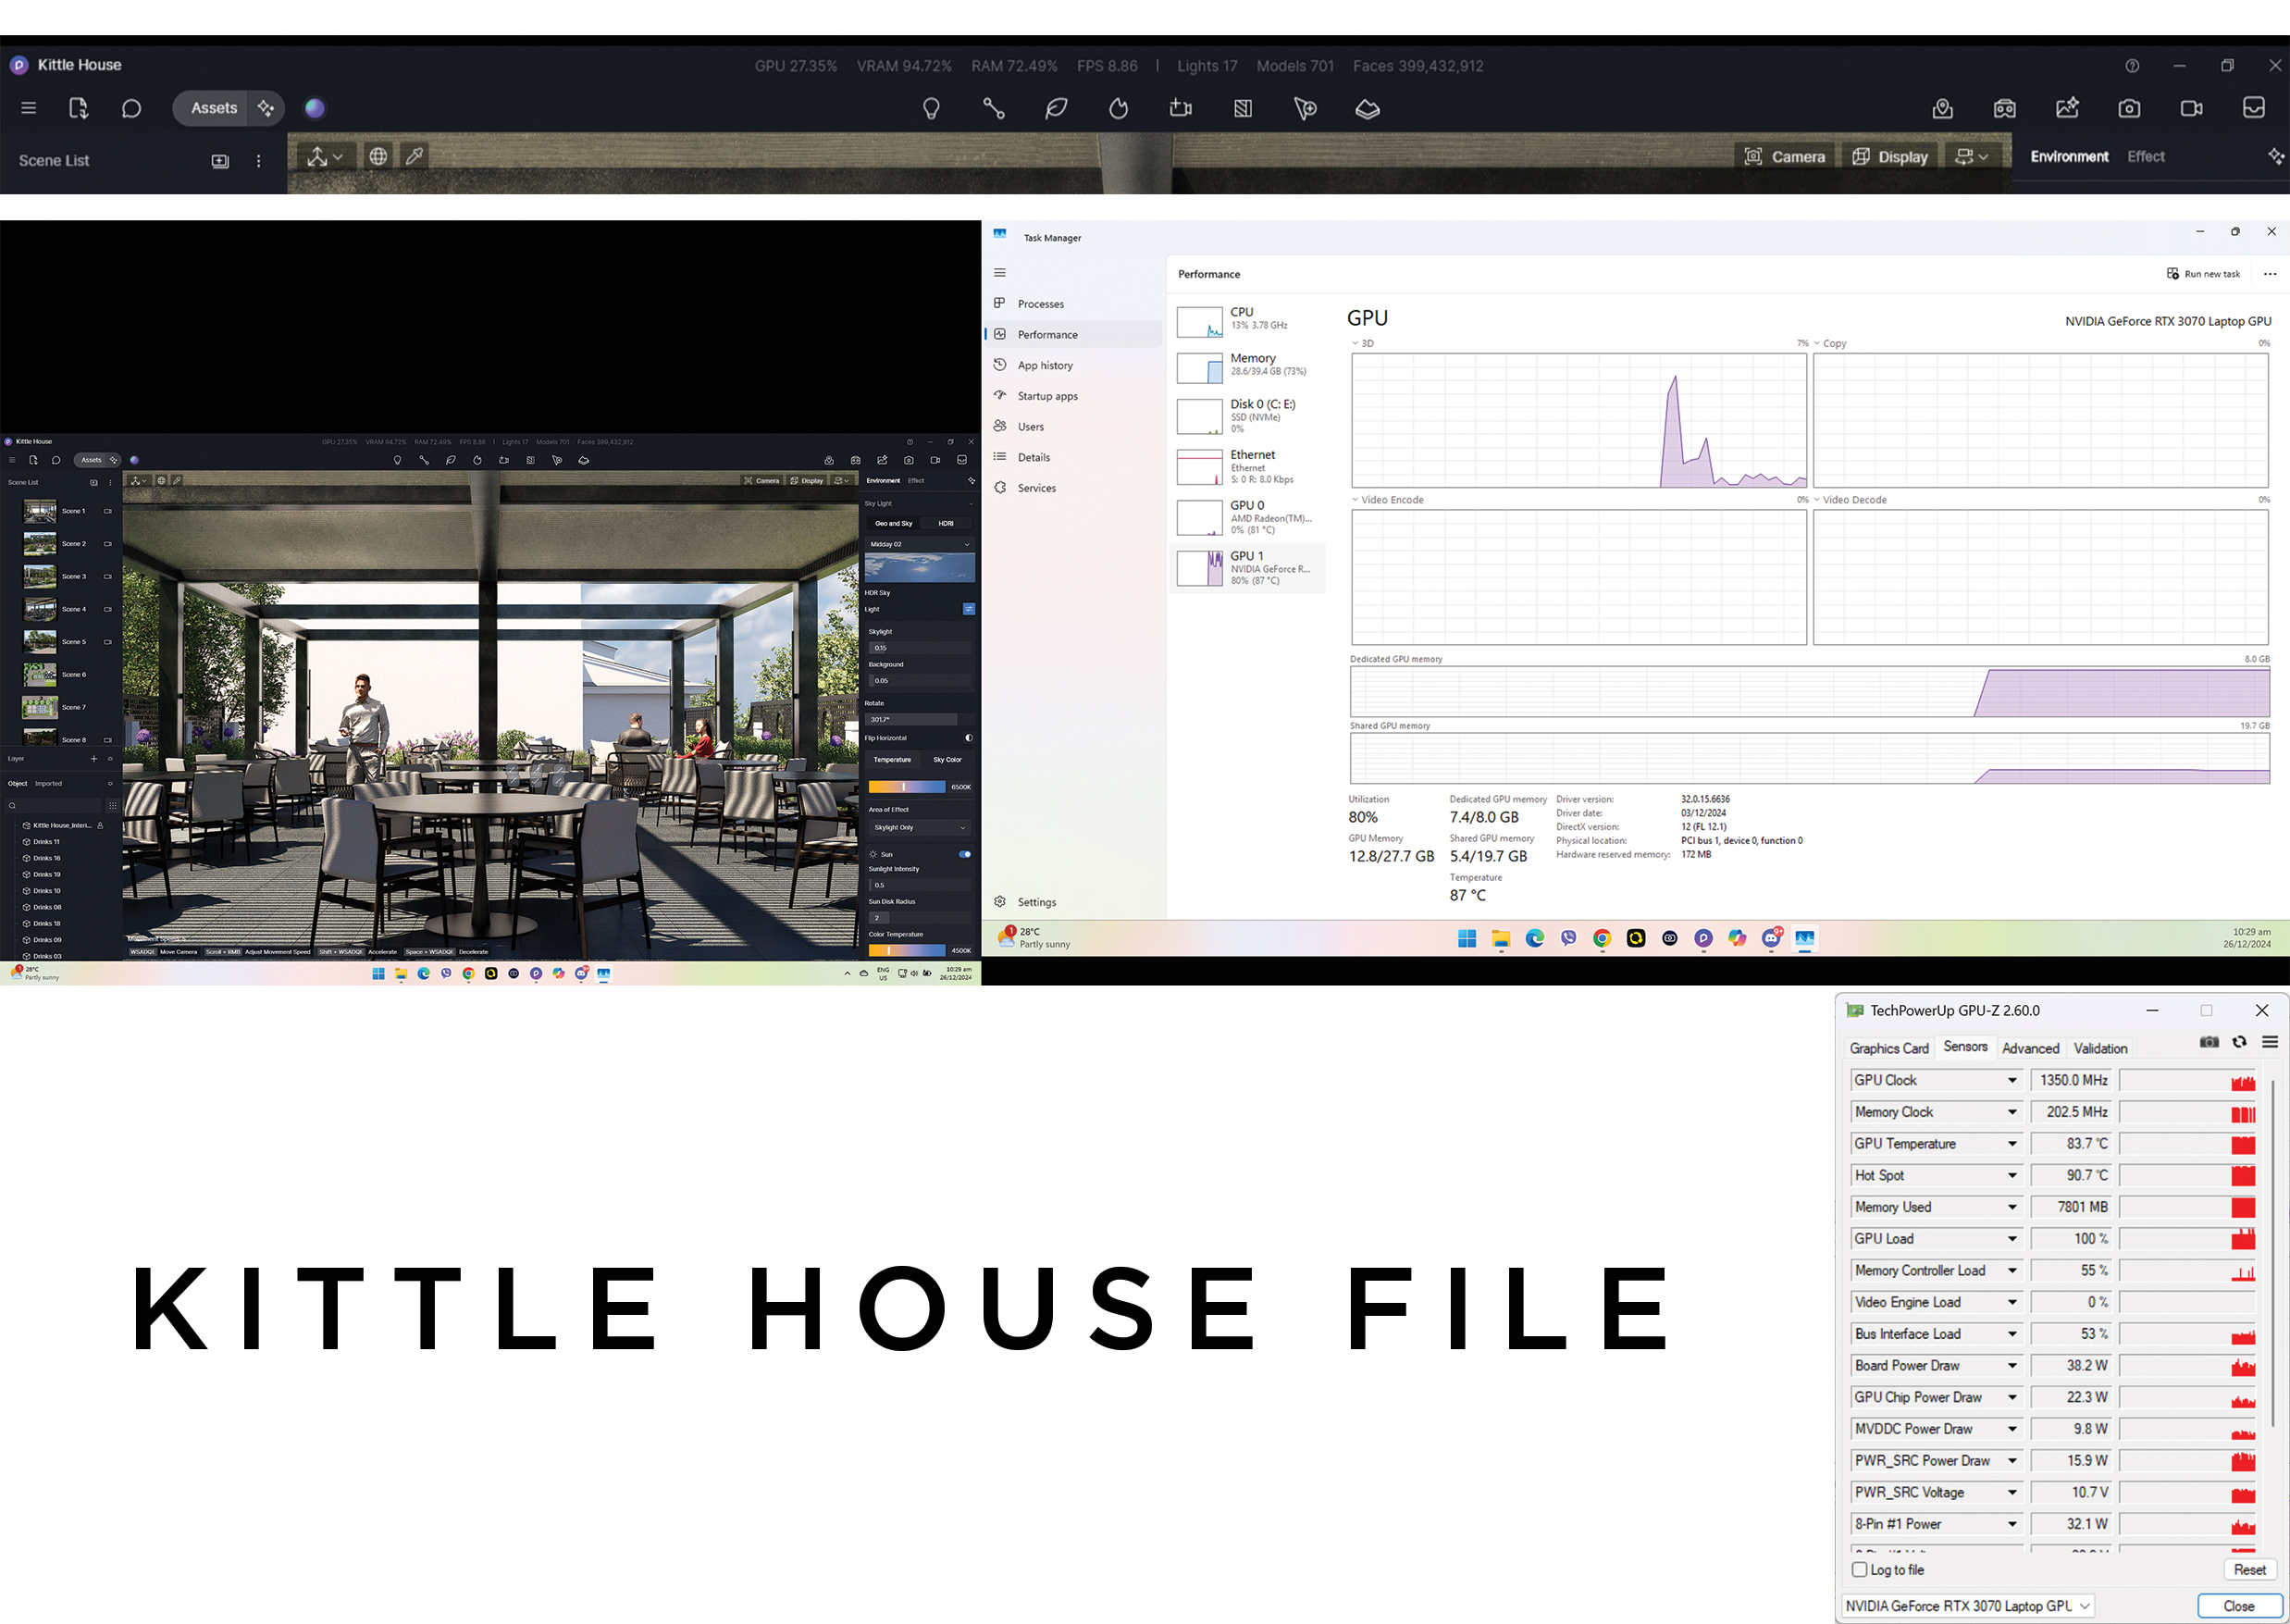
I have tested the two D5 Files that you have sent. There seems to be quite a difference in the numbers in D5 Statistic, Task Manager, and GPU-Z. I do recommend using GPU-Z to monitor your VRAM and other factors since it is more accurate compared to the other two.
You might want to notice the VRAM Percentage in D5 Render, Task Manager, and GPU-Z.
Additionally, I also noticed that there are plenty of vegetation assets that were used to propagate trees and are mainly evident in the Orthographic Top View. I do suggest hiding them in scenes where they are not seen so it would lessen GPU Usage and eventually make the preview window smoother.
Thank you for the suggestions. I will download GPU-Z and try to keep an eye on VRAM usage. However this still doesn’t answer the question of how the optimized file (with 14,000,000 fewer faces) is still consuming more resources then the non-optimized file? Logistically that doesn’t seem to make any sense.
May I know which parameters you were basing your assessment on? If it’s solely from D5 Statistics, our team has confirmed that the optimization effect may not be immediately visible in these numbers. You can continue working and perform normal operations after optimizing the project, for the numbers to reflect.
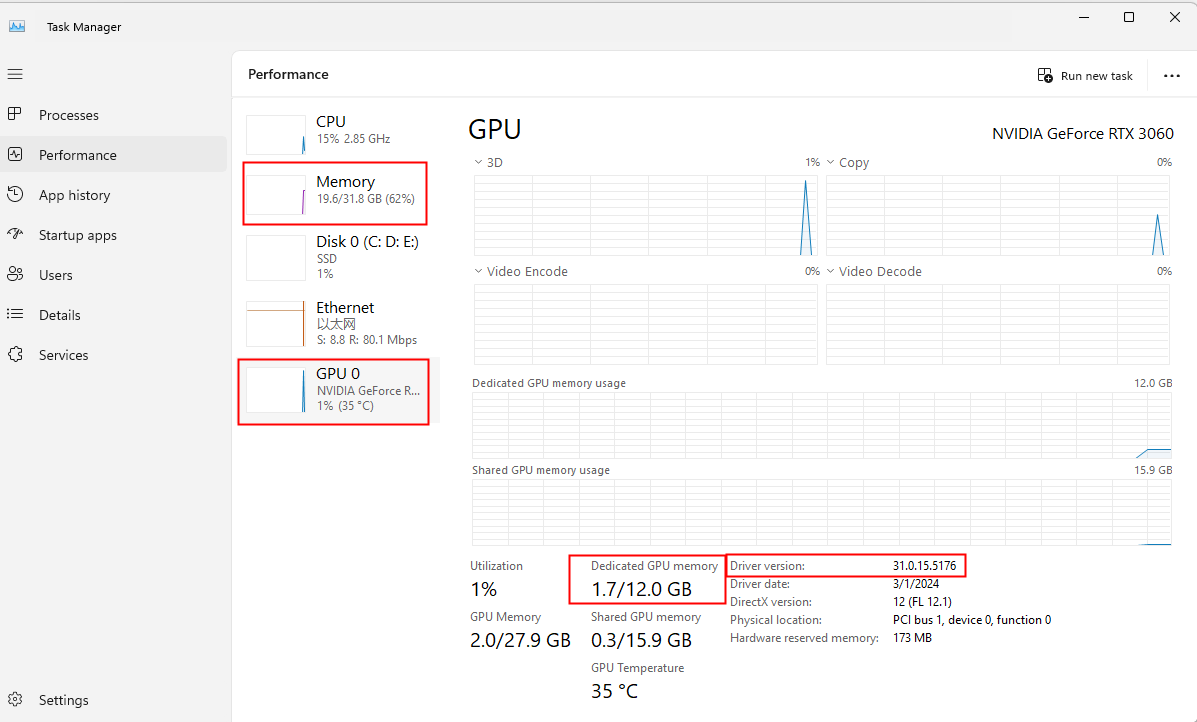
In my test, there weren’t any significant differences in VRAM percentage as reported by D5, and there was even a contrasting result from the task manager, which doesn’t make much sense. We typically monitor the numbers shown in the blue box and do not rely on the percentage in the red box that I have annotated.
Since the two sources (D5 and TaskManager) provided me with inconsistent results and numbers, I opted to install GPU-Z considering that it is much more reliable and accurate compared to the other two. As you may have observed:
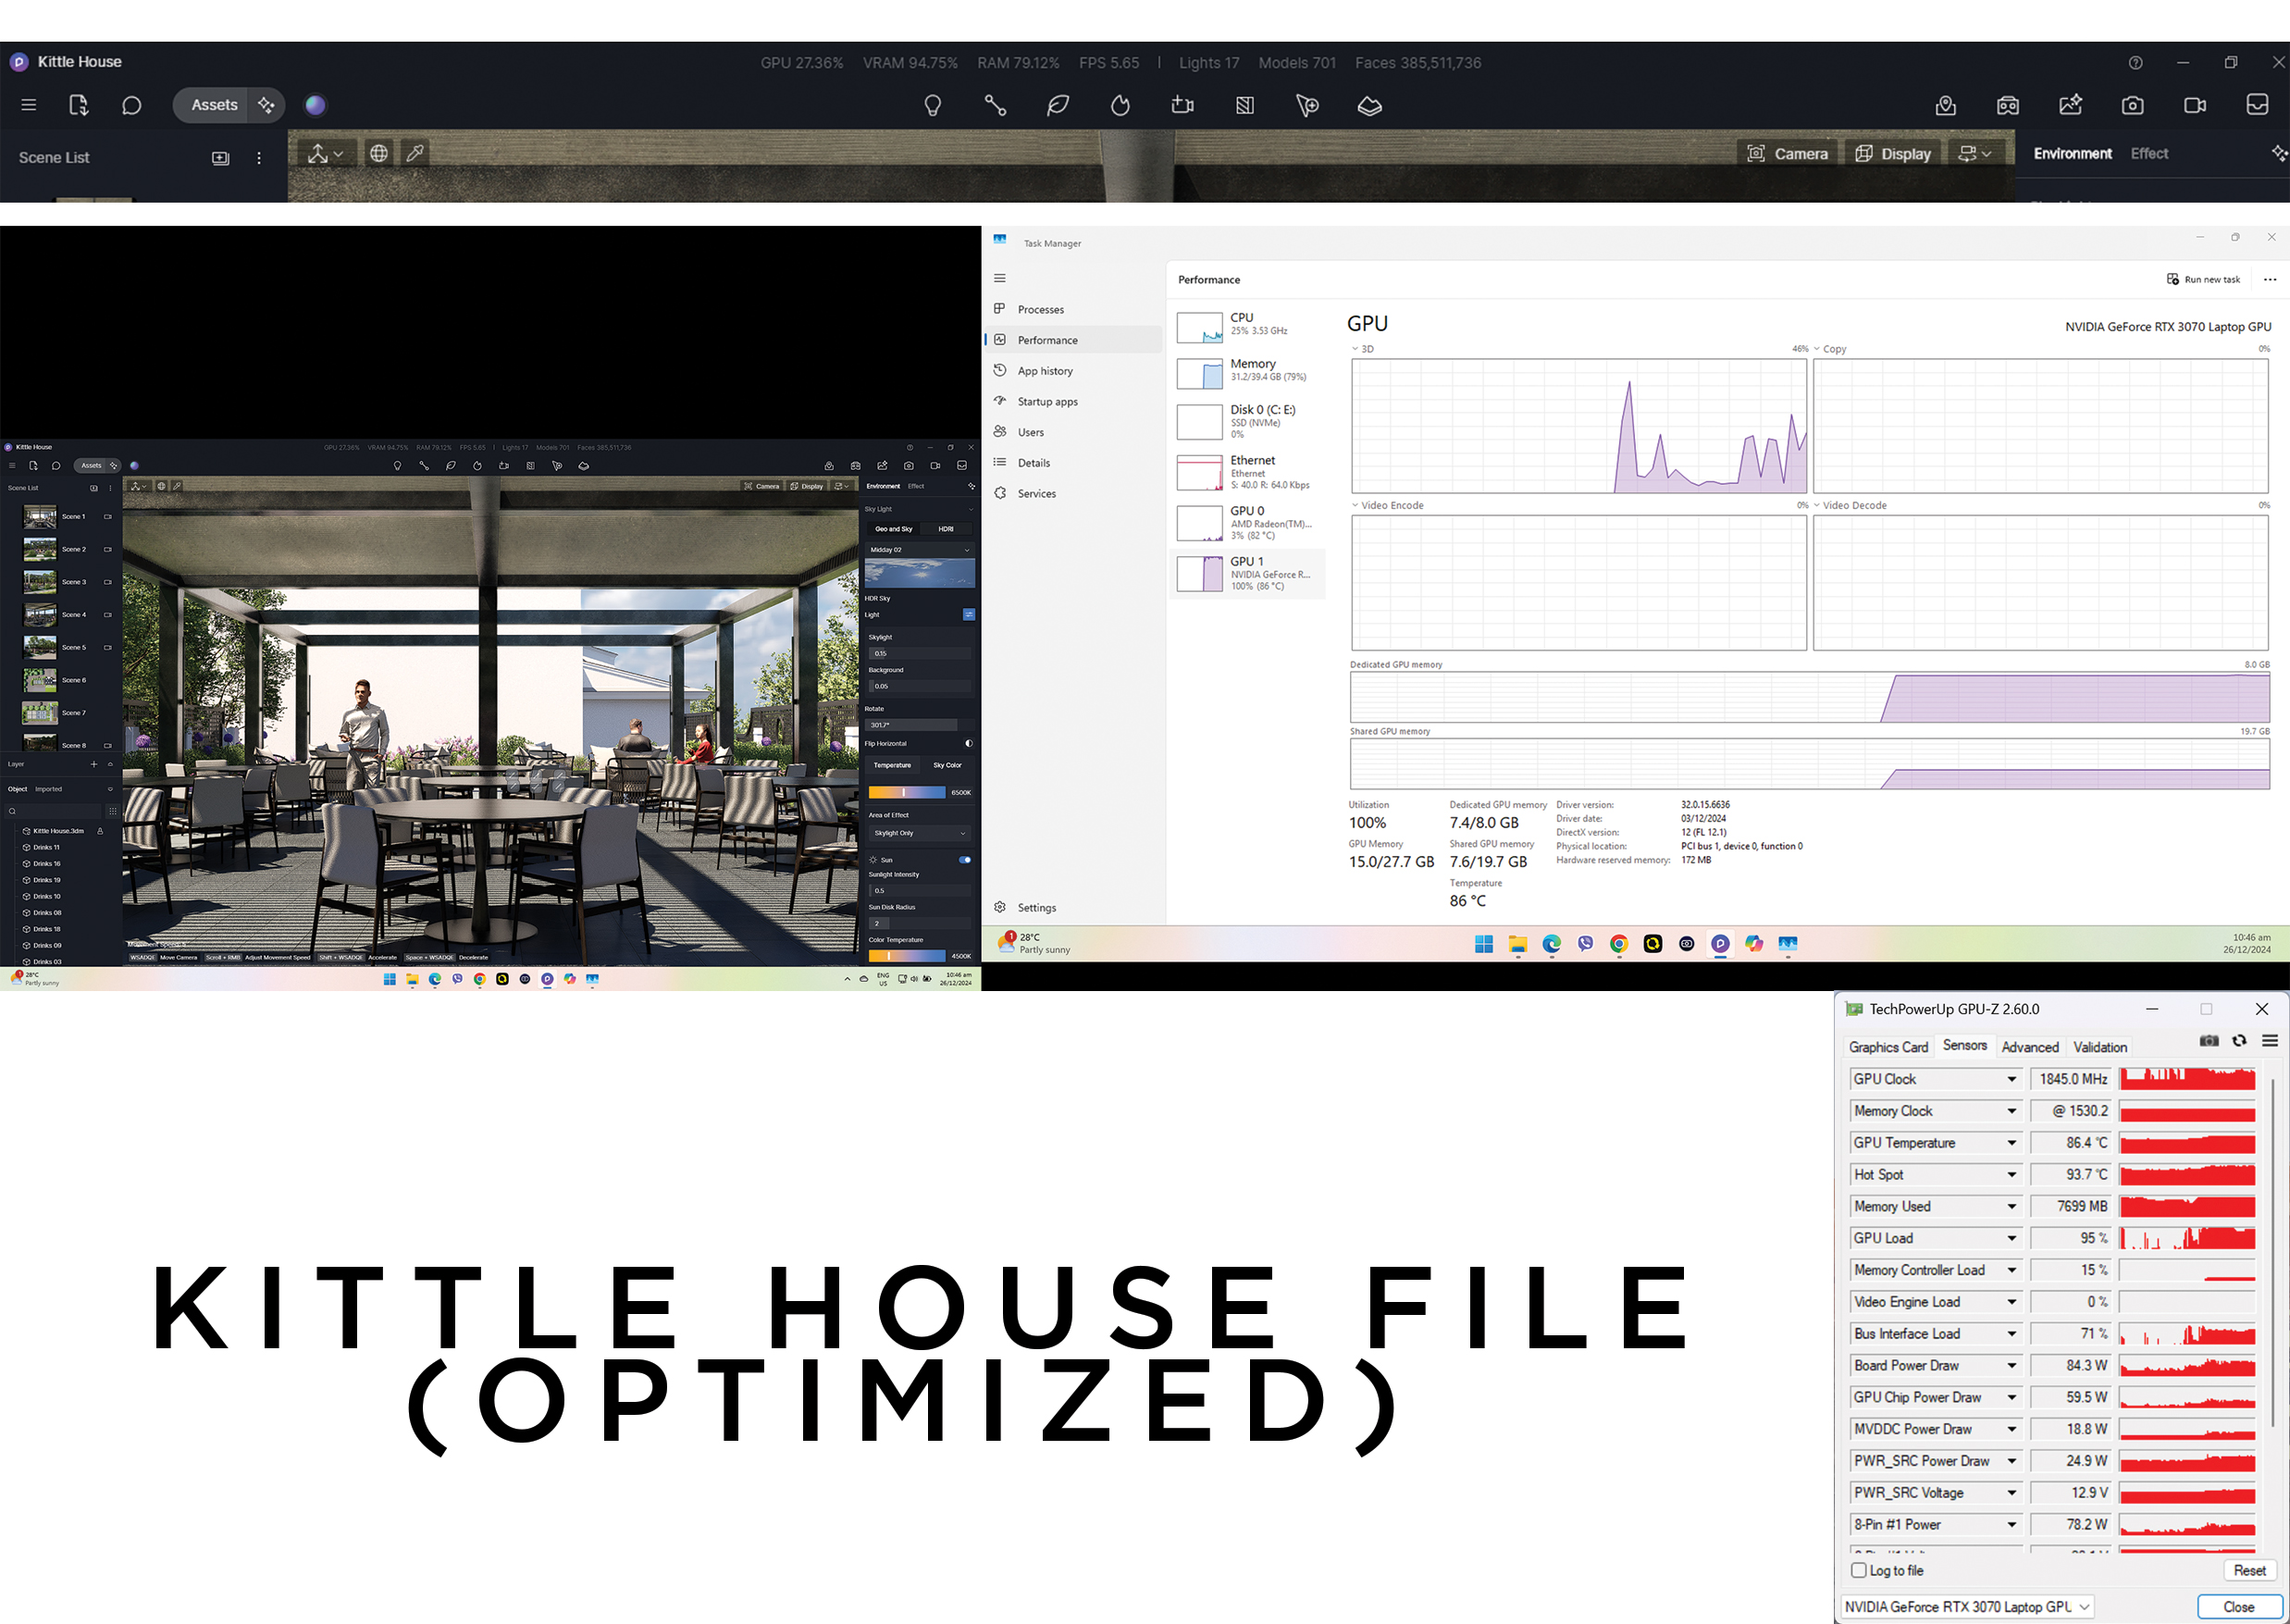
I am using GPU-Z to monitor VRAM levels as you suggested. Please see attached screenshots. The non-optimized file (identified by 444,744,079 faces) is utilizing 13,705 MB VRAM. The optimized file (identified by 385,511,736 faces) is utilizing 15,456 MB as observed in GPU-Z. This is what doesn’t make any sense to me. The file with several million fewer faces is consuming more VRAM then the other.
I just re-checked your file and checked the values that you have mentioned. The non-optimized file (identified by 444,744,079 faces) is utilizing 7789 MB while the optimized file (identified by 385,511,736 faces) is utilizing 7776 MB.
This issue may have something to do with your PC Environment considering that the problem was not evident on my end. Although the difference is not that high, the optimized file does not exceed the Non-Optimized file GPU Usage.
Can you perhaps confirm if this problem is also occurring in your other files as well? Or is it only specific to this file?
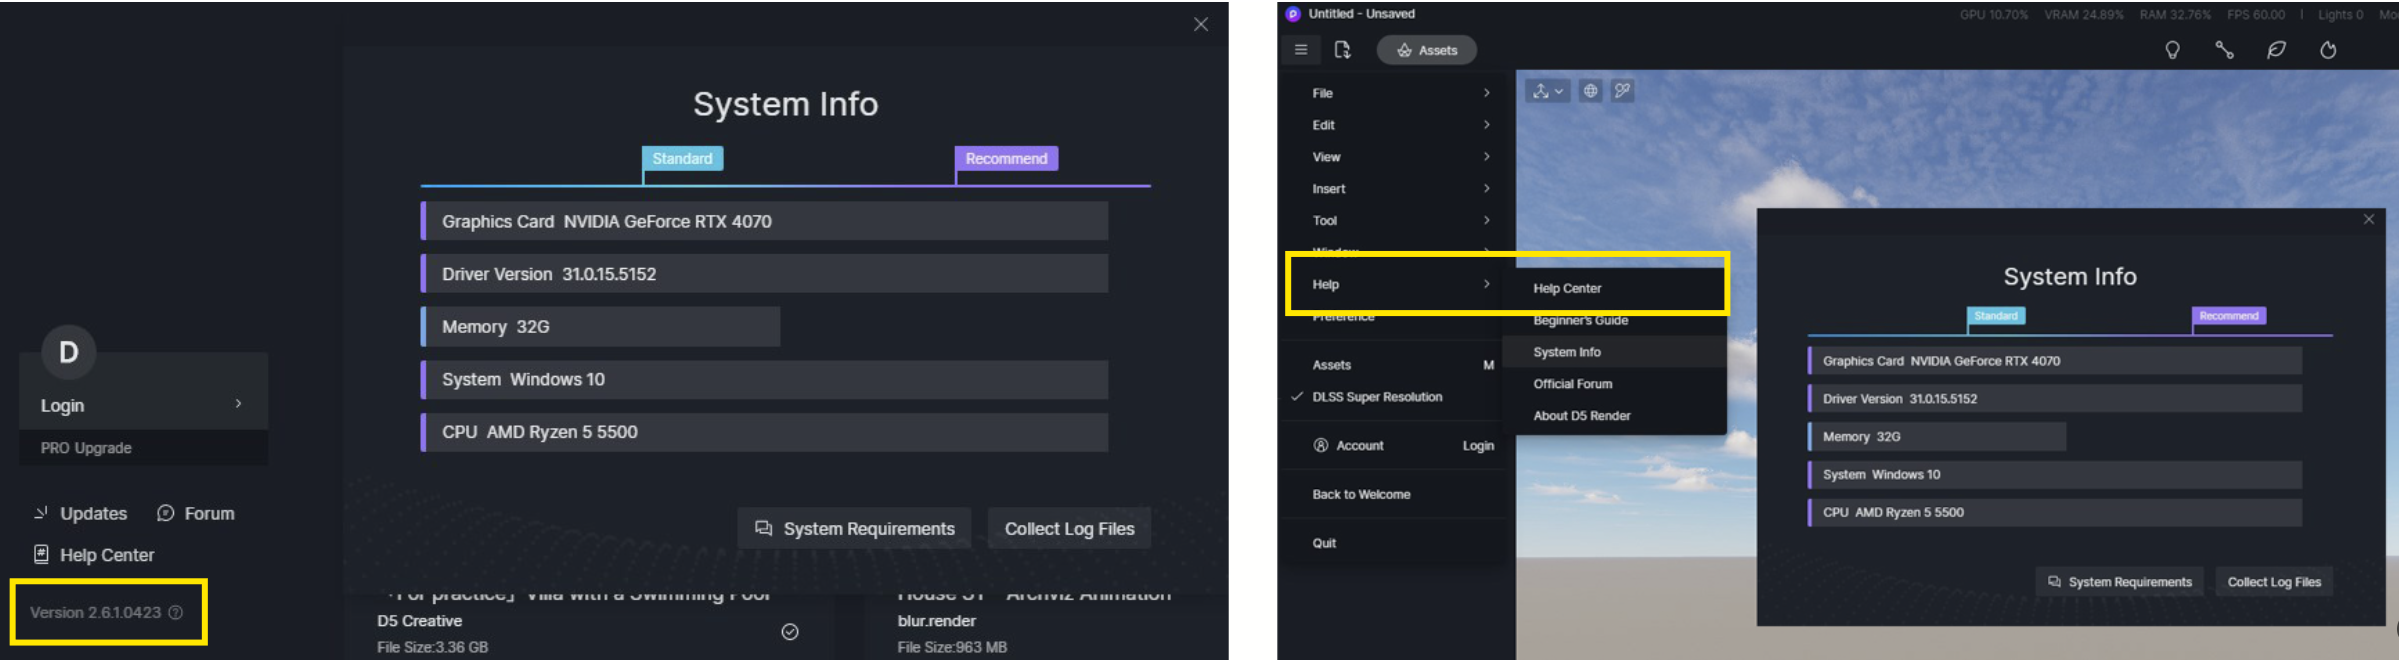
Just for reference, I Start D5 Render with administrator privileges (which can improve the stability to a great extent).
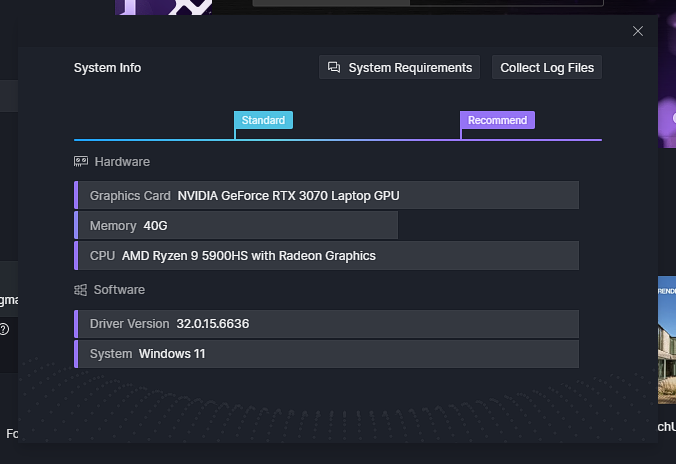
For my System Info:
It might be good to do a clean reinstallation of your graphics driver and see if there are any differences (let me know)